Great plot libraries
Matplotlib
Matplotlib: main functions
For figure printing, this allows to automatically crop the figure so that only used space is printed:
fig.savefig('2016.png',dpi=600, bbox_inches='tight')
Here is the DataCamp Cheat Sheet:

This plot is taken from DataCamp.
The Swarbee plot of seaborn
import matplotlib.pyplot as plt
import seaborn as sns
from sklearn.datasets import load_iris
import pandas as pd
import numpy as np

iris = load_iris()

df = pd.DataFrame(data= np.c_[iris['data'], iris['target']],
                   columns= iris['feature_names'] + ['species'])

# Create bee swarm plot with Seaborn's default settings
sns.swarmplot(x='species',y='petal length (cm)',data=df)
plt.xlabel('species')
plt.ylabel('length')
plt.show()
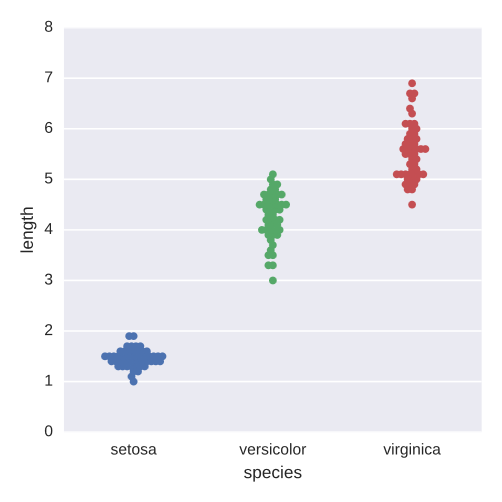
This plot is taken from DataCamp.
Computation of PDF and CDF plots (having only PDF)
Here I don’t have the data behind, but it is roughly a dataframe with a PDF called df[‘fraction’]. We want a multiplot with both PDF and CDF.
# This formats the plots such that they appear on separate rows
fig, axes = plt.subplots(nrows=2, ncols=1)

# Plot the PDF
df.fraction.plot(ax=axes[0], kind='hist', bins=30, normed=True, range=(0,.3))
plt.show()

# Plot the CDF
df.fraction.plot(ax=axes[1], kind='hist', bins=30, normed=True, cumulative=True, range=(0,.3))
plt.show()
And the output is:

This plot is taken from DataCamp.
Plotly and Dash
Installation
conda install -c conda-forge dash-renderer
conda install -c conda-forge dash
conda install -c conda-forge dash-html-components
conda install -c conda-forge dash-core-components
conda install -c conda-forge plotly